


Page 170 - IMPC Education Book_low res
P. 170
MINERALS INDUSTRY   EDUCATION AND TRAINING II


            regions in Figure 1 are represented (i.e. the 18% of mineral processing
            graduates for which no data were available on the numbers of females
            included no women).

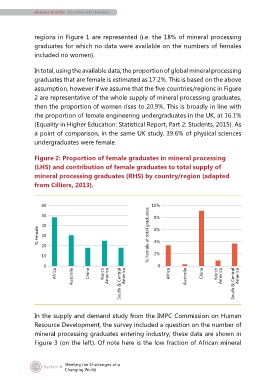
            In total, using the available data, the proportion of global mineral processing
            graduates that are female is estimated as 17.2%. This is based on the above
            assumption, however if we assume that the five countries/regions in Figure
            2 are representative of the whole supply of mineral processing graduates,
            then the proportion of women rises to 20.9%. This is broadly in line with
            the proportion of female engineering undergraduates in the UK, at 16.1%
            (Equality in Higher Education: Statistical Report, Part 2: Students, 2015). As
            a point of comparison, in the same UK study, 39.6% of physical sciences
            undergraduates were female.

            Figure 2: Proportion of female graduates in mineral processing
            (LHS) and contribution of female graduates to total supply of
            mineral processing graduates (RHS) by country/region (adapted
            from Cilliers, 2013).


              60
              50                                 8%
             % Female 40                        % Female of total graduates 10%
                                                 6%
              30
                                                 4%
              20
              10                                 2%
               0                                  0
                   Africa  Australia  China  North   America  South & Central   America  Africa  Australia  China  North   America  South & Central   America


            In the supply and demand study from the IMPC Commission on Human
            Resource Development, the survey included a question on the number of
            mineral processing graduates entering industry; these data are shown in
            Figure 3 (on the left). Of note here is the low fraction of African mineral


                     Meeting the Challenges of a
           158   Section 4
                     Changing World

